Unknown Chirp Message Decode
Est. read time: 2 minutes | Posted: September 30, 2025 by John Gentile
Another unknown signal challenge from DrSDR, the Chip-Text-Message- here a series of linear frequency modulated (LFM) chirps are representing bits, and we need to find the underlying text message in the waveform. An “upchirp” (where frequency is increasing as ) represents a bit 1, where as an opposite “downchirp” (where frequency decreases as ) represents a bit 0.
We are given the following waveform constants:
bw = 12e3     # Bandwidth of chirp sweep (Hz)
pw = 50e-3    # Chirp pulse width (seconds)
n_bits = 144  # Number of bits
sps = 2400    # Samples/symbol
import numpy as np
import matplotlib.pyplot as plt
from scipy.io import wavfile
from scipy import signal
from rfproto import plot, sig_gen
First lets read in the .wav file and verify the sampling frequency given in the file metadata.
fs, wav_data = wavfile.read("./Chirp_IQ_Fs48KHz.wav")
N = len(wav_data)
print(f"Read {N} samples with fs={fs}")
Read 345600 samples with fs=48000
Given we know the message is made up of up and down chirps, lets use time-frequency analysis techniques, like generating a spectrogram to see if we can see the linear frequency sweeps.
input_iq = wav_data[:, 0] + 1j * wav_data[:, 1]
min_mag = np.min(np.abs(input_iq))
plt.specgram(input_iq, NFFT=256, noverlap=128, pad_to=1024, Fs=fs, vmin=min_mag)
plt.xlabel('Time (s)')
plt.ylabel('Frequency (Hz)')
plt.show()
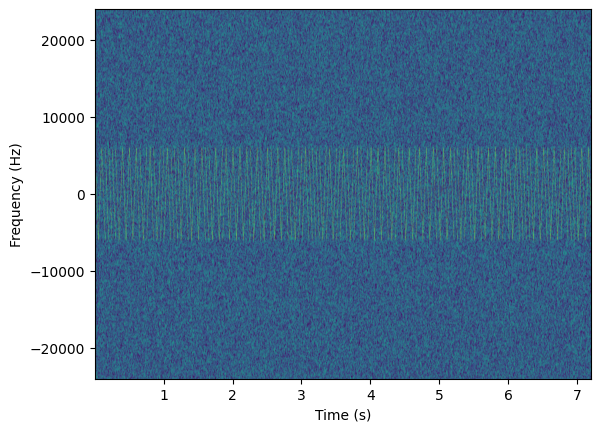
Here we can see there are varying up and down LFM chirps and that the 12 kHz chirp bandwidth is centered around DC (0 Hz).
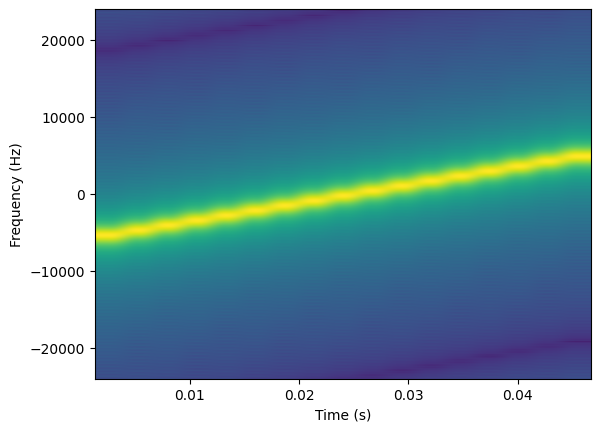
Similar to radar pulse compression processing, we can use a matched filter to de-chirp the input signal. Since we are given the pulse width and chirp bandwidth of the modulated bits, the matched filter is simply a prototype of the generated pulse, then reversed and complex conjugated.
n_chirp = fs * pw # samp_freq (Samples/sec) * pulse_width (sec) => Samples
upchirp = sig_gen.cmplx_dt_lfm_chirp(1.0, -6e3, 6e3, fs, int(n_chirp))
plt.specgram(upchirp, pad_to=1024, Fs=fs)
plt.xlabel('Time (s)')
plt.ylabel('Frequency (Hz)')
plt.show()
mf_up = np.conj(np.flip(upchirp))
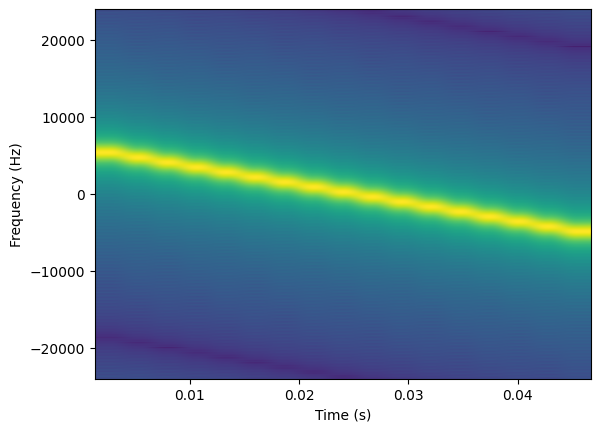
downchirp = sig_gen.cmplx_dt_lfm_chirp(1.0, 6e3, -6e3, fs, int(n_chirp))
plt.specgram(downchirp, pad_to=1024, Fs=fs)
plt.xlabel('Time (s)')
plt.ylabel('Frequency (Hz)')
plt.show()
mf_down = np.conj(np.flip(downchirp))
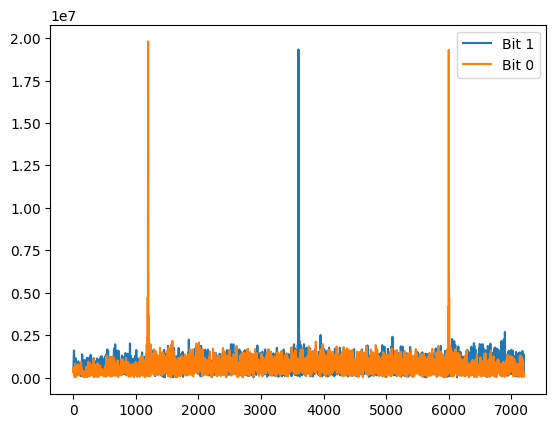
We could do a frequency domain method of convolution (e.g. take FFT of both input signal and matched filter template, then multiply in frequency domain, then IFFT to get back to time domain), but here lets just stay in time domain and convolve (filter) the input signal using both the up and down chirp matched filters. We take the magnitude of the complex outputs to see the convolution peaks.
mf_output_1 = np.abs(signal.convolve(input_iq, mf_up, mode='same'))
mf_output_0 = np.abs(signal.convolve(input_iq, mf_down, mode='same'))

plt.plot(mf_output_1, label='Bit 1')
plt.plot(mf_output_0, label='Bit 0')
plt.legend()
plt.show()
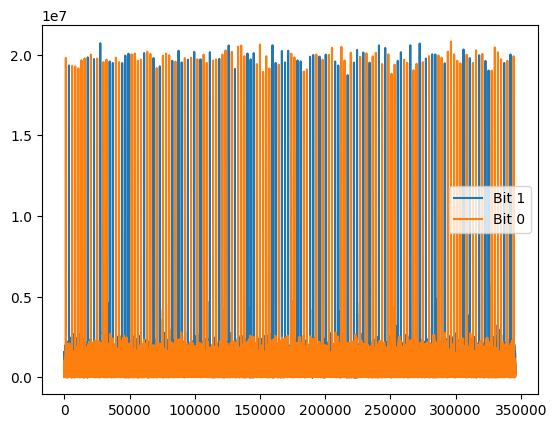
We can see lots of convolution peaks! Though given we have 2400 samples/symbol, we should zoom to see that there is lots of dead space (very high SNR post matched filtering!) between detected “bits”.
plt.plot(mf_output_1[:3*sps], label='Bit 1')
plt.plot(mf_output_0[:3*sps], label='Bit 0')
plt.legend()
plt.show()
We were also given that there are 144 total bits in the signal, which does match the length post-matched-filtering:
print(len(mf_output_0) / sps)
144.0
We can also visually see that the correlation peaks happen to nicely align around the center of a “symbol window” (e.g. we can see a 0 bit peak at around sample 1200 within a 2400 sample/symbol period). Thus, we can build a very simple decoder that looks across both matched filtered outputs in 2400 sample chunks, and whichever chunk has the highest value, we append that bit to an output decode buffer:
bits = []
for i in range(n_bits):
    b0_max = np.max(mf_output_0[i*2400 : (i+1)*2400])
    b1_max = np.max(mf_output_1[i*2400 : (i+1)*2400])
    bits.append(0 if b0_max > b1_max else 1)
Finally, we can then convert the bit vector to 8-bit ASCII characters to get the final text message output!
message = ""
num_chars = n_bits // 8 # 8 bits per ASCII char
for i in range(num_chars):
    curr_bits = bits[i * 8 : (i+1) * 8]
    byte_str = ''.join(map(str, curr_bits))
    byte_val = int(byte_str, 2)
    message += chr(byte_val)

print(f"Final demodulated and decoded message: {message}")
Final demodulated and decoded message: AS8J-RJ873S-J2VAK
Maintained by John Gentile • Found a problem on this site? File an Issue
This work is licensed under a Creative Commons Attribution 4.0 International License.![]()